Examples from the gridgen-c library
These are some examples from the original gridgen-c library.
In [1]:
%matplotlib inline

import warnings
warnings.simplefilter('ignore')

import numpy
from matplotlib import pyplot
import pandas
import seaborn
clear_bkgd = {'axes.facecolor':'none', 'figure.facecolor':'none'}
seaborn.set(style='ticks', context='notebook', rc=clear_bkgd, color_codes=True)

import pygridgen

from dochelpers import read_boundary, plot_grid
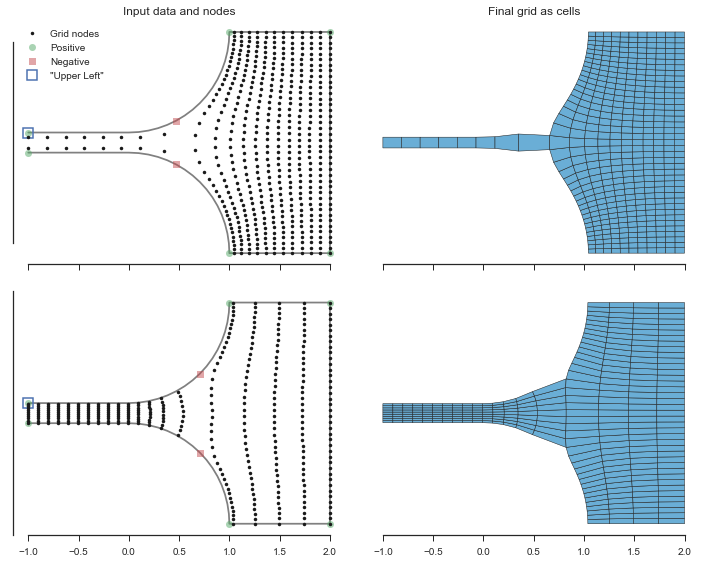
Sensitivity to \(\beta\)
This examples shows how a subtle change in the placement of the negative turning points changes how many nodes are “captured” into the side channel and alters the layout of the whole grid.
In [2]:
fig, axes = pyplot.subplots(figsize=(10, 8), ncols=2, nrows=2,
                            sharex=True, sharey=True)

for n, (axrow, leg_loc) in enumerate(zip(axes, ('upper left', None)), 1):
    x, y, beta, ul_idx = read_boundary(n)
    grid = pygridgen.Gridgen(x, y, beta, ul_idx=ul_idx, shape=(40, 20))
    plot_grid(grid, data_ax=axrow[0], cell_ax=axrow[1], leg_loc=leg_loc)

fig.tight_layout()
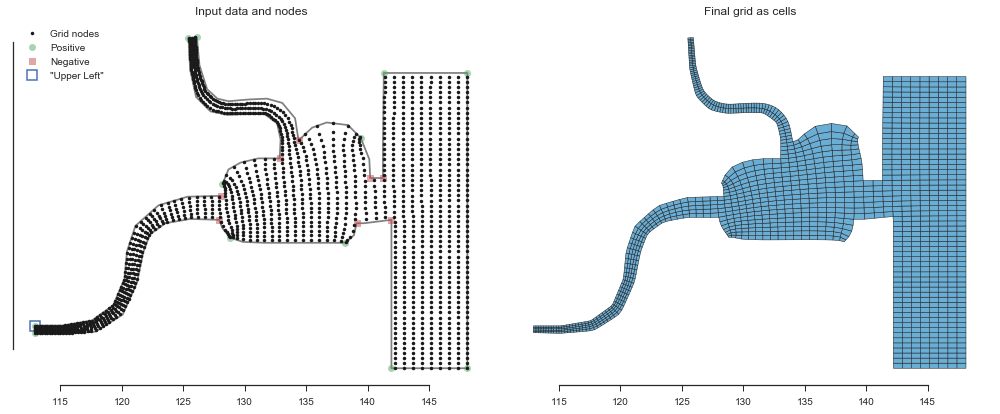
Basic Estuary
In [3]:
x, y, beta, ul_idx = read_boundary(0)
grid = pygridgen.Gridgen(x, y, beta, ul_idx=ul_idx, shape=(90, 120))

fig, (data_ax, cell_ax) = pyplot.subplots(figsize=(14, 7), ncols=2, sharey=True)
plot_grid(grid, data_ax=data_ax, cell_ax=cell_ax, leg_loc='upper left')
fig.tight_layout()
These are just weird
In [4]:
fig, (data_ax, cell_ax) = pyplot.subplots(figsize=(10, 10), ncols=2, sharey=True)
x, y, beta, ul_idx = read_boundary(3)
grid = pygridgen.Gridgen(x, y, beta, ul_idx=ul_idx, shape=(40, 125))
plot_grid(grid, data_ax=data_ax, cell_ax=cell_ax, leg_loc=(1.0, 0.5))
fig.tight_layout()
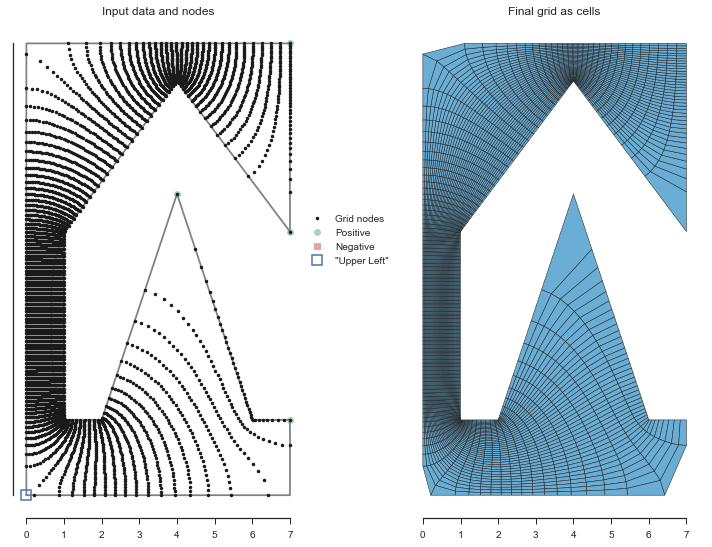
In [5]:
fig, (data_ax, cell_ax) = pyplot.subplots(figsize=(15, 7), ncols=2, sharey=True)
x, y, beta, ul_idx = read_boundary(4)
grid = pygridgen.Gridgen(x, y, beta, ul_idx=ul_idx, shape=(40, 80))
plot_grid(grid, data_ax=data_ax, cell_ax=cell_ax, leg_loc='upper right')
fig.tight_layout()
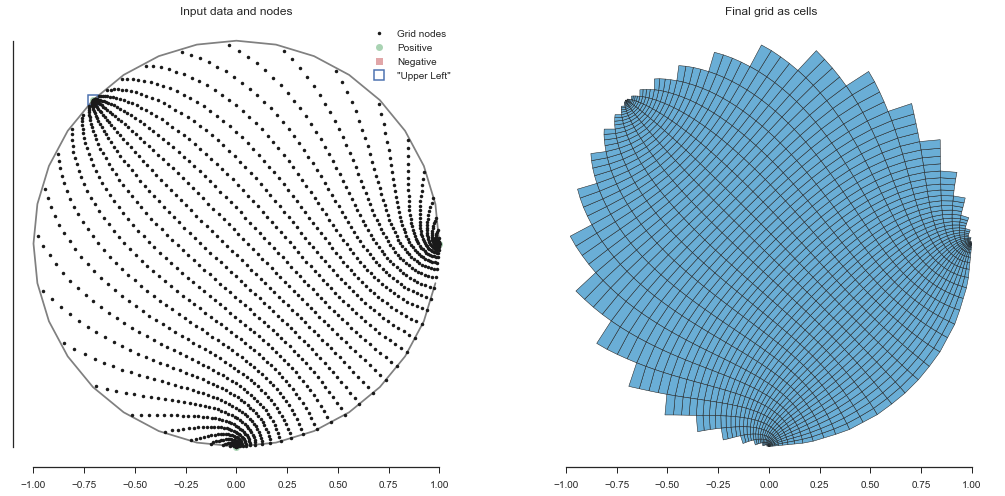
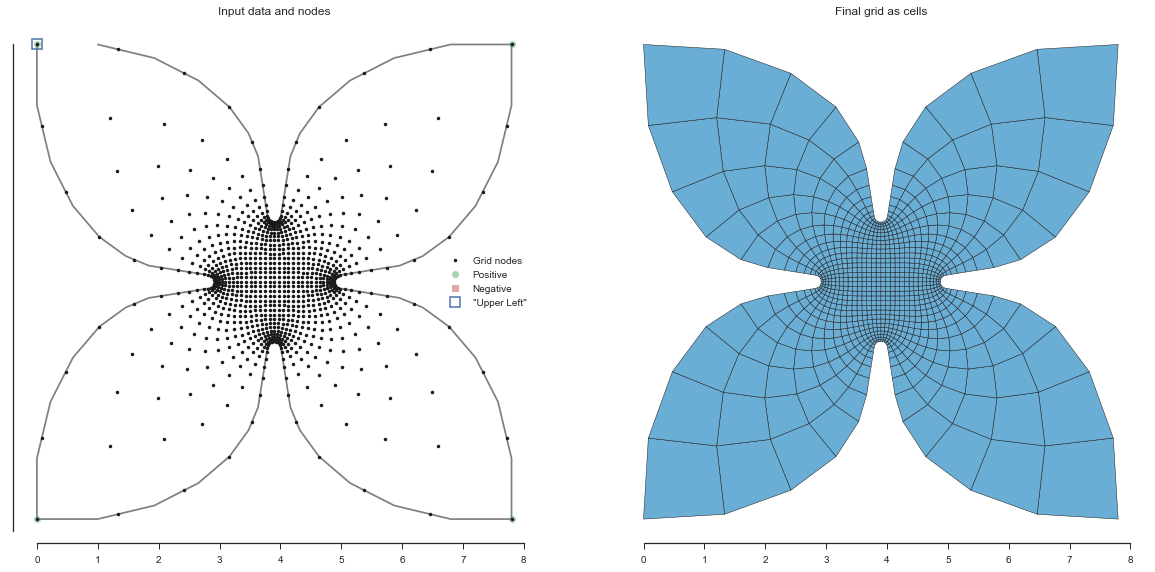
In [6]:
x, y, beta, ul_idx = read_boundary(5)
grid = pygridgen.Gridgen(x, y, beta, ul_idx=ul_idx, shape=(31, 31))

fig, (data_ax, cell_ax) = pyplot.subplots(figsize=(17, 8), ncols=2, sharey=True)
plot_grid(grid, data_ax=data_ax, cell_ax=cell_ax, leg_loc='right')
fig.tight_layout()