The pygridgen API
-
class
pygridgen.grid.Focus(*foci)[source]¶ Bases:
objectReturn a container for a sequence of Focus objects.
The sequence is populated by using
add_focus(), which defines a point (xooryo), around which the grid is focused by a factor for the providedextentin the along the givenaxis. The region of focusing will be approximately Gaussian, and the resolution will be increased by approximately the value offactor.Calls to the object return transformed coordinates:
xf, yf = foc(x, y)
where x and y must be within [0, 1], and are typically a uniform, normalized grid. The focused grid will be the result of applying each of the focus elements in the sequence they are added to the series.
Parameters: - None
Examples
>>> foc = Focus()
>>> foc.add_focus(0.2, axis='x', factor=3.0, extent=0.20)
>>> foc.add_focus(0.6, axis='y', factor=5.0, extent=0.35)
>>> x, y = numpy.mgrid[0:1:3j, 0:1:3j]
>>> xf, yf = foc(x, y)
>>> print(xf)
[[0.         0.         0.        ]
 [0.36587759 0.36587759 0.36587759]
 [1.         1.         1.        ]]
>>> print(yf)
[[0.         0.62484147 1.        ]
 [0.         0.62484147 1.        ]
 [0.         0.62484147 1.        ]]
-
add_focus(pos, axis, factor=2.0, extent=0.1)[source]¶ Add a single point of focus along an axis.
This adds a focused location to a grid and can be called multiple times in either the x- or y-direction.
Parameters: - pos : float
Relative position within the grid of the focus. This must be in the range [0, 1]
- axis : string (‘x’ or ‘y’)
Axis along which the grid will be focused.
- factor : float
Amount to focus grid. Creates cell sizes that are factor smaller (factor > 1) or larger (factor < 1) in the focused region.
- extent : float
Lateral extent of focused region.
-
class
pygridgen.grid.CGrid(x, y)[source]¶ Bases:
objectCurvilinear Arakawa C-Grid.
The basis for the CGrid class are two arrays defining the verticies of the grid in Cartesian (for geographic coordinates, see
CGrid_geo). An optional mask may be defined on the cell centers. Other Arakawa C-grid properties, such as the locations of the cell centers (rho-points), cell edges (u and v velocity points), cell widths (dx and dy) and other metrics (angle, dmde, and dndx) are all calculated internally from the vertex points.Input vertex arrays may be either masked or regular numpy arrays. If masked arrays are used, the mask will be a combination of the specified mask (if given) and the masked locations.
Parameters: - x, y : numpy.ndarray
Arrays of the x/y vertex/node positions
Examples
>>> import numpy as np
>>> import pygridgen
>>> x, y = numpy.mgrid[0.0:7.0, 0.0:8.0]
>>> x = numpy.ma.masked_where((x < 3) & (y < 3), x)
>>> y = numpy.ma.MaskedArray(y, x.mask)
>>> grd = pygridgen.grid.CGrid(x, y)
>>> print(grd.x_rho)
[[-- -- -- 0.5 0.5 0.5 0.5]
 [-- -- -- 1.5 1.5 1.5 1.5]
 [-- -- -- 2.5 2.5 2.5 2.5]
 [3.5 3.5 3.5 3.5 3.5 3.5 3.5]
 [4.5 4.5 4.5 4.5 4.5 4.5 4.5]
 [5.5 5.5 5.5 5.5 5.5 5.5 5.5]]
>>> print(grd.mask)
[[0. 0. 0. 1. 1. 1. 1.]
 [0. 0. 0. 1. 1. 1. 1.]
 [0. 0. 0. 1. 1. 1. 1.]
 [1. 1. 1. 1. 1. 1. 1.]
 [1. 1. 1. 1. 1. 1. 1.]
 [1. 1. 1. 1. 1. 1. 1.]]
-
x¶ x-coordinate of the grid vertices (a.k.a. nodes)
-
y¶ y-coordinate of the grid vertices (a.k.a. nodes)
-
mask¶ Mask for the cells (same as mask_rho)
-
x_rho¶ x-coordinates of cell centroids
-
y_rho¶ y-coordinates of cell centroids
-
mask_rho¶ Returns the mask for the cells
-
x_u¶ x-coordinate of u-point (leading edge in i-direction?)
-
y_u¶ y-coordinate of u-point (leading edge in i-direction?)
-
mask_u¶ Mask for the u-points
-
x_v¶ x-coordinate of y-point (leading edge in j-direction?)
-
y_v¶ y-coordinate of y-point (leading edge in j-direction?)
-
mask_v¶ mask for the v-points
-
x_psi¶ x-coordinate of the anchor node for each cell? (upper left?)
-
y_psi¶ y-coordinate of the anchor node for each cell? (upper left?)
-
mask_psi¶ mask for the psi-points
-
dx¶ dimension of cell in x-direction?
-
pm
-
dy¶ dimension of cell in y-direction?
-
pn
-
dndx
-
dmde
-
angle
-
angle_rho
-
orthogonality¶ Calculate orthogonality error in radians
-
calculate_orthogonality(**kwds)¶ calculate_orthogonality is deprecated, use orthogonality instead!
Should deprecate in favor of property
orthogonality
-
mask_polygon(polyverts, mask_value=False)[source]¶ Mask Cartesian points contained within the polygon defined by
polyverts.A cell is masked if the cell center (x_rho, y_rho) is within the polygon. Other sub-masks (mask_u, mask_v, and mask_psi) are updated automatically.
A mask_value=False may be specified to alter the value of the mask set within the polygon (e.g., mask_value=True for water points)
Parameters: - polyverts : sequence of 2-tuples or numpy array (N, x)
The x/y coordinates of the polygon used to mask the grid.
- mask_value : bool, optional (default = False)
The value of the mask to be set for cells whose centroids are inside the polygon.
-
class
pygridgen.grid.CGrid_geo(lon, lat, proj, use_gcdist=True, ellipse='WGS84')[source]¶ Bases:
pygridgen.grid.CGridCurvilinear Arakawa C-grid defined in geographic coordinates.
For a geographic grid, the cell widths are determined by the great circle distances. Angles, however, are defined using the projected coordinates, so a projection that conserves angles must be used. This means typically either Mercator (projection=’merc’) or Lambert Conformal Conic (projection=’lcc’).
Parameters: - lon, lat : numpy.ndarrays
Array of grid vertex/node positions in decimal degrees (i.e., longitude and latitude).
- proj : pyproj.Proj
A projection object that can translate
lonandlatinto Cartesian coordinates.- use_gcdist : bool, optional (default = True)
Toggles the use of great circle distances when computing cell dimensions.
- ellipse : str, optional (default = ‘WGS84’)
The ellipsoid reference for
lonandlat,
-
dx¶ dimension of cell in x-direction?
-
dy¶ dimension of cell in y-direction?
-
lon¶ Shorthand for lon_vert
-
lat¶ Shorthand for lat_vert
-
class
pygridgen.grid.Gridgen(xbry, ybry, beta, shape, ul_idx=0, focus=None, proj=None, nnodes=14, precision=1e-12, nppe=3, newton=True, thin=True, checksimplepoly=True, verbose=False, autogen=True)[source]¶ Bases:
pygridgen.grid.CGridMain class for curvilinear-orthogonal grid generation.
Parameters: - xbry, ybry : array-like
One dimensional sequences of the x- and y-coordinates of the grid boundary.
- beta : array-like
Turning values of each coordinate defined by
xbryandybry. The sum of all beta values must equal 4. If you think about this like the right-hand rule of basic physics, positive turning points (+1) face up and work to close the boundary polygon. Negative turning points (-1) open it up (e.g., to define a side channel or other complexity). In between these points, neutral points should be assigned a value of 0.- shape : two-tuple of ints (ny, nx)
The number of cells that would cover the full spatial extent of the grid in standard C-order (i.e., rows, then columns).
- ul_idx : optional int (default = 0)
The index of the what should be considered the upper left corner of the grid boundary in the
xbry,ybry, and beta inputs. This is actually more arbitrary than it sounds. Put it some place convenient for you, and the algorithm will conceptually rotate the boundary to place this point in the upper left corner. Keep that in mind when specifying the shape of the grid.- focus :
Focus, optional A focus object to tighten/loosen the grid in certain sections.
- proj : pyproj.Proj, optional
A pyproj projection to be used to convert lat/lon coordinates to a projected (Cartesian) coordinate system (e.g., UTM, state plane).
- nnodes : int, optional (default = 14)
The number of nodes used in grid generation. This affects the precision and computation time. A rule of thumb is that this should be equal to or slightly larger than -log10(precision).
- precision : float, optional (default = 1.0e-12)
The precision with which the grid is generated. The default value is good for lat/lon coordinate (i.e., smaller magnitudes of boundary coordinates). You can relax this to e.g., 1e-3 when working in state plane or UTM grids and you’ll typically get better performance.
- nppe : int, optional (default = 3)
The number of points per internal edge. Lower values will coarsen the image.
- newton : bool, optional (default = True)
Toggles the use of Gauss-Newton solver with Broyden update to determine the sigma values of the grid domains. If False simple iterations will be used instead.
- thin : bool, optional (default = True)
Toggle to True when the (some portion of) the grid is generally narrow in one dimension compared to another.
- checksimplepoly : bool, optional (default = True)
Toggles a check to confirm that the boundary inputs form a valid geometry.
- verbose : bool, optional (default = True)
Toggles the printing of console statements to track the progress of the grid generation.
- autogen : bool, optional (default = True)
Toggles the automatic generation of the grid. Set to False if you want to delay calling the
generate_gridmethod.
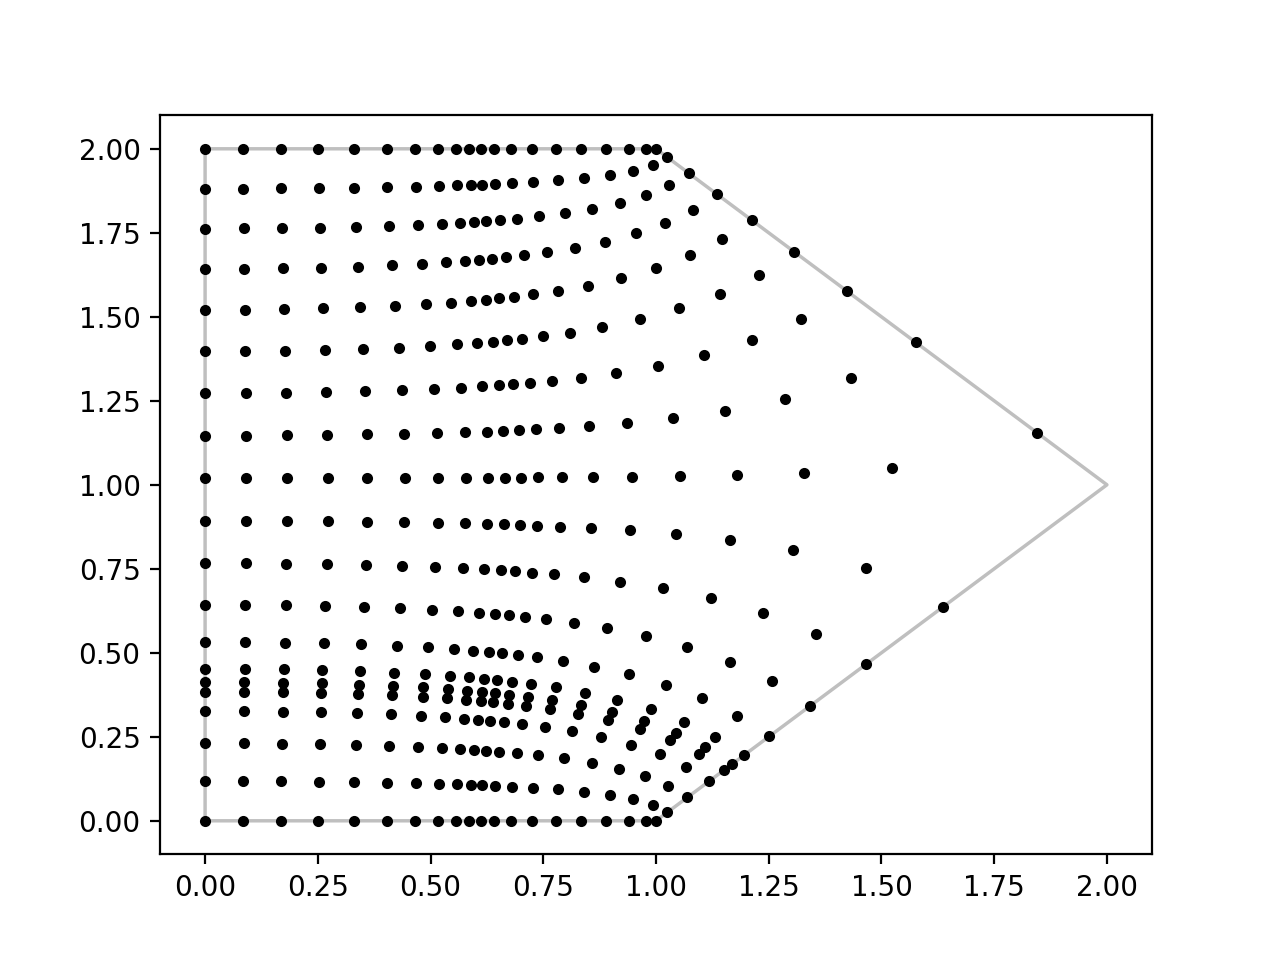
Examples
import matplotlib.pyplot as plt
import pygridgen
# define the boundary (pentagon)
x = [0, 1, 2, 1, 0, 0]
y = [0, 0, 1, 2, 2, 0]
beta = [1, 1, 0, 1, 1]
# define the focus
focus = pygridgen.grid.Focus()
focus.add_focus(0.5, 'x', factor=3, extent=0.2)
focus.add_focus(0.75, 'y', factor=5, extent=0.1)
# create the grid
grid = pygridgen.Gridgen(x, y, beta, shape=(20, 20), focus=focus)
# plot the grid
fig, ax = plt.subplots()
ax.plot(x, y, 'k-', lw=1.25, zorder=0, alpha=0.25)
ax.plot(grid.x, grid.y, 'k.', zorder=5)
plt.show()
(Source code, png, hires.png, pdf)

-
sigmas¶ Some weird intermediate value that takes a long time to the C code to compute with complex boundaries.
-
nsigmas¶ The number of sigma values.
-
nx¶ Number of nodes in the x-direction (columns).
-
ny¶ Number of nodes in the y-direction (rows).
-
shape¶ The shape of the overall grid (row, columns).