Basic grid generation
In [1]:
%matplotlib inline

import warnings
warnings.simplefilter('ignore')

import numpy
from matplotlib import pyplot
import seaborn
clear_bkgd = {'axes.facecolor':'none', 'figure.facecolor':'none'}
seaborn.set(style='ticks', context='notebook', rc=clear_bkgd, color_codes=True)

import pygridgen

from dochelpers import plot_grid
Two basic quantities define the domain of a grid: the boundary coordinates (x & y) and the \(\beta\) parameters. The \(\beta\) parameter describes the direction of the turning at each boundary point and the sum of all beta parameters must be 4 for a given boundary.
Conceptually, the boundaries are always traversed counter clockwise. Thus, if the boundary turns in a positive direction (according to the right-hand rule), it’s working to close the boundary and \(\beta = +1\). Conversely, if the turning works to keep the boundary open and creates a side channel, \(\beta = -1\). Neutral points that don’t actively close or open the boundary are assigned values of \(0\).
In other words, in a simple, concave shape have four points where \(\beta = +1\) that act to define a pseudo-rectangle of curvi-linear space.
And then, obviously, you define the number of rows and columns of nodes
in the grid as two-tuple called shape.
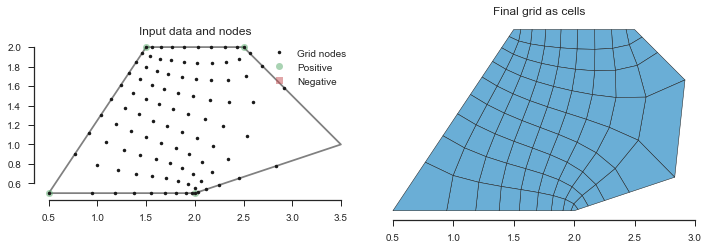
Let’s look at a simple trapzoid as the most basic of examples.
In [2]:
x = numpy.array([0.5, 2.0, 2.5, 1.5, 0.5])
y = numpy.array([0.5, 0.5, 2.0, 2.0, 0.5])
beta = numpy.array([1, 1, 1, 1, 0])
rows = 10
cols = 5

fig, (data_ax, cell_ax) = pyplot.subplots(figsize=(10, 5), ncols=2)
grid = pygridgen.Gridgen(x, y, beta, shape=(rows, cols))
plot_grid(grid, data_ax=data_ax, cell_ax=cell_ax, leg_loc='upper left')
fig.tight_layout()

Without dramatically changing anything, we can add a neutral point to make a pentagon.
In [3]:
x = numpy.array([0.5, 2.0, 3.5, 2.5, 1.5, 0.5])
y = numpy.array([0.5, 0.5, 1.0, 2.0, 2.0, 0.5])
beta = numpy.array([1, 1, 0, 1, 1, 0])

fig, (data_ax, cell_ax) = pyplot.subplots(figsize=(10, 5), ncols=2)
grid = pygridgen.Gridgen(x, y, beta, shape=(10, 10))
plot_grid(grid,data_ax=data_ax, cell_ax=cell_ax, leg_loc='upper right')
fig.tight_layout()
Side channels: using \(\beta = -1\)
If you have complex shapes with side channels, and don’t define an negative turning points, you’ll likely get undesired results. In the example below, the grid does not work it’s way into the right side channel.
In [4]:
x = numpy.array([0.5, 2.0, 2.0, 3.5, 3.5, 2.0, 2.0, 0.5, 0.5])
y = numpy.array([0.5, 0.5, 1.5, 1.5, 2.5, 2.5, 3.5, 3.5, 0.5])
beta = numpy.array([1, 1, 0, 0, 0, 0, 1, 1, 0])

fig, (data_ax, cell_ax) = pyplot.subplots(figsize=(10, 5), ncols=2, sharex=True)
grid = pygridgen.Gridgen(x, y, beta, shape=(10, 10))
plot_grid(grid,data_ax=data_ax, cell_ax=cell_ax, leg_loc='upper right')
fig.tight_layout()
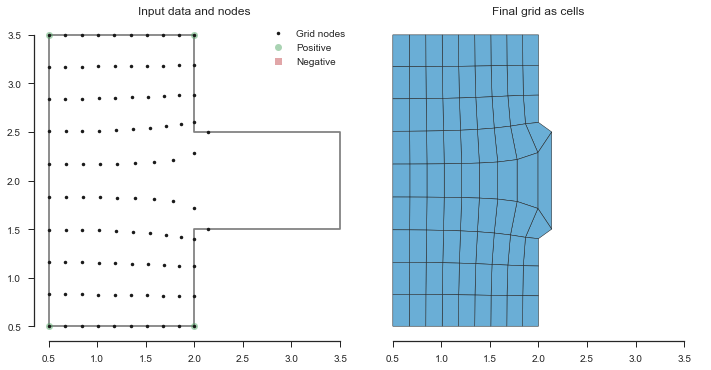
The first thing we might try, is put two of the \(\beta = +1\) values in the out corners of the side channel. But, again, this really isn’t want we want
In [5]:
beta = numpy.array([1, 0, 0, 1, 1, 0, 0, 1, 0])

fig, (data_ax, cell_ax) = pyplot.subplots(figsize=(10, 5), ncols=2, sharex=True)
grid = pygridgen.Gridgen(x, y, beta, shape=(10, 10))
plot_grid(grid,data_ax=data_ax, cell_ax=cell_ax, leg_loc='upper right')
fig.tight_layout()
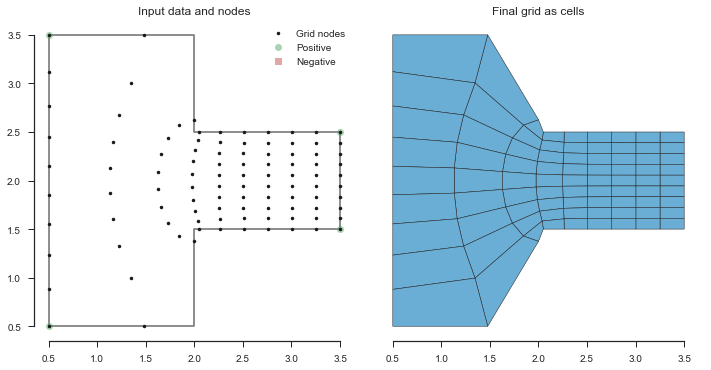
The trick here is to use \(\beta = -1\) to define the left channel as a side channel, which tells the grid generator to squeeze in there a little more naturally. Note that if we add to points that atre \(-1\), we’ll need to add others that are \(+1\) to seem the domain “square” (i.e., \(\sum \beta = 4\)).
In [6]:
beta = numpy.array([1, 1, -1, 1, 1, -1, 1, 1, 0])

fig, (data_ax, cell_ax) = pyplot.subplots(figsize=(10, 5), ncols=2, sharex=True)
grid = pygridgen.Gridgen(x, y, beta, shape=(10, 10))
plot_grid(grid,data_ax=data_ax, cell_ax=cell_ax, leg_loc='upper right')
fig.tight_layout()
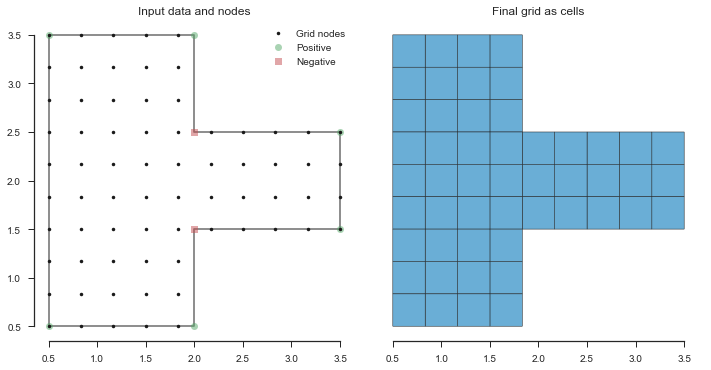
There, now we have a lovely, uniform grid throughout the domain.
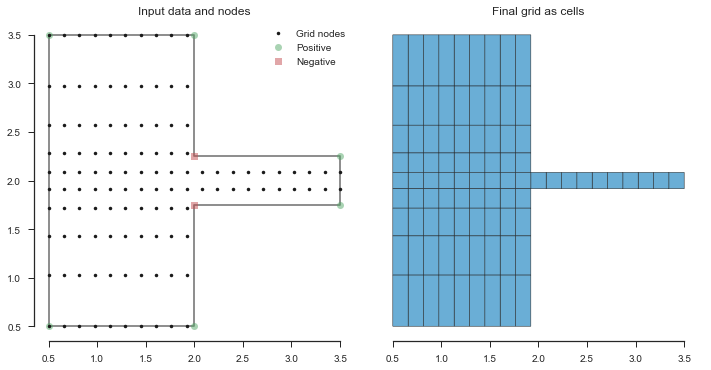
Using focus
What if the side channel was much more narrow than the example above, but we still wanted to model it with at least 4 grid nodes in the y-direction?
In [7]:
x = numpy.array([0.50, 2.00, 2.00, 3.50, 3.50, 2.00, 2.00, 0.50, 0.50])
y = numpy.array([0.50, 0.50, 1.75, 1.75, 2.25, 2.25, 3.50, 3.50, 0.50])
beta = numpy.array([1, 1, -1, 1, 1, -1, 1, 1, 0])

fig, (data_ax, cell_ax) = pyplot.subplots(figsize=(10, 5), ncols=2, sharex=True)
grid = pygridgen.Gridgen(x, y, beta, shape=(10, 10))
plot_grid(grid,data_ax=data_ax, cell_ax=cell_ax, leg_loc='upper right')
fig.tight_layout()
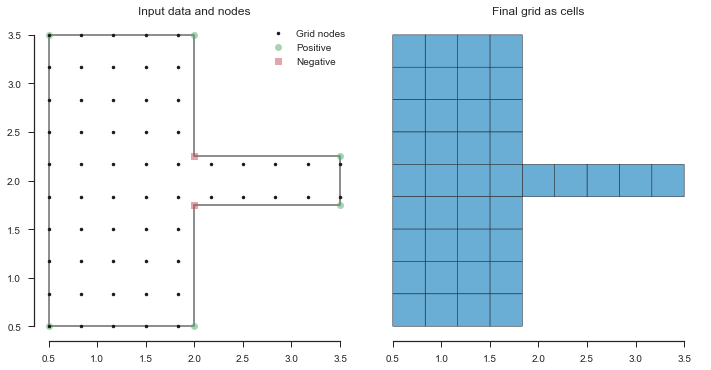
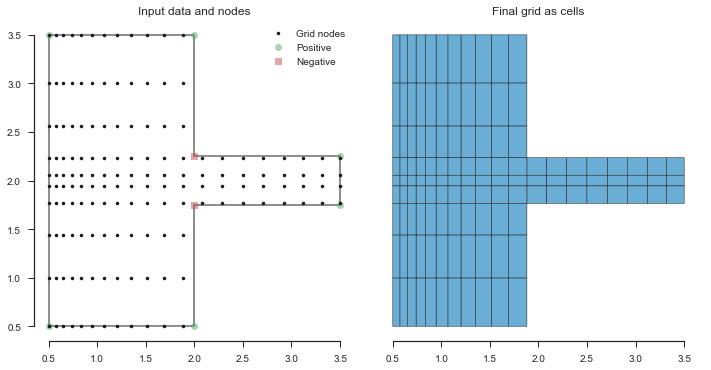
One option would be to take a brute-force approach and increase the grid resolution until we have 4 nodes in the side channel.
In [8]:
grid = pygridgen.Gridgen(x, y, beta, shape=(20, 10))

fig, (data_ax, cell_ax) = pyplot.subplots(figsize=(10, 5), ncols=2, sharex=True)
plot_grid(grid,data_ax=data_ax, cell_ax=cell_ax, leg_loc='upper right')
fig.tight_layout()
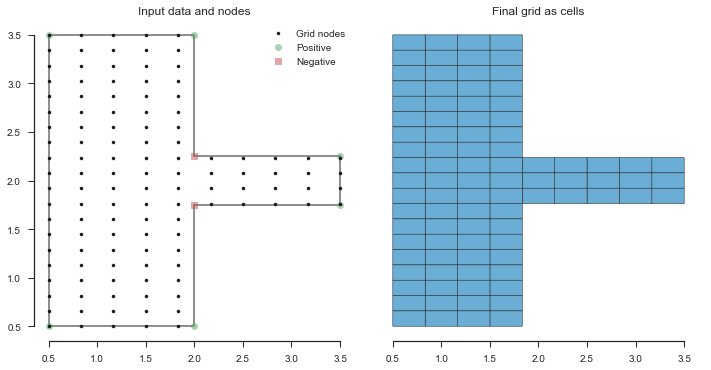
For such a simple case, this would be fine. However, in more complex models, this could dramatically increase the computational burden of the model. Instead, we could make the y-resolution of the nodes more dense in the side channel, and more sparse else where.
To accomplish this, we use a concept introduced in the prgridgen
library called “focus”. Focus basically applies a gaussian
transformation of the coordinates of the nodes.
To use focus, you first create an empty focus object. Then use the
:meth:~pygridgen.Focus.add_focus method to create an area of focus.
The parameters for add_focus are:
pos,axis: the relative position and axis at which the focus will be placesfactor: the scaling factor to be applied to the node densityextent: the relative “area of influence” of the focus area.
pos and extent are in relative grid coordinates. In other words,
they range from 0 to 1. The value of axis is either "x" or
"y", and factor should be greater than 1 to make the nodes more
dense or less than one to make them more sparse.
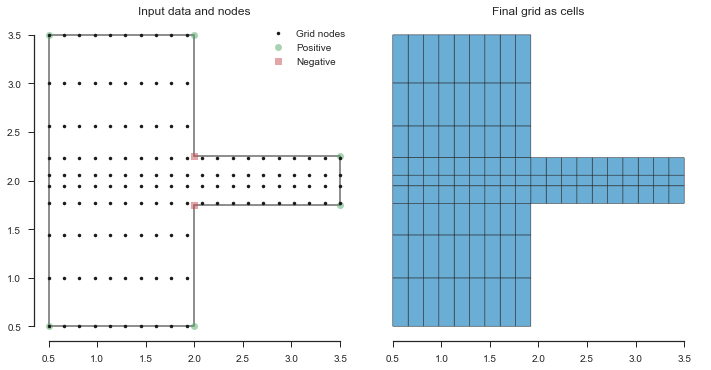
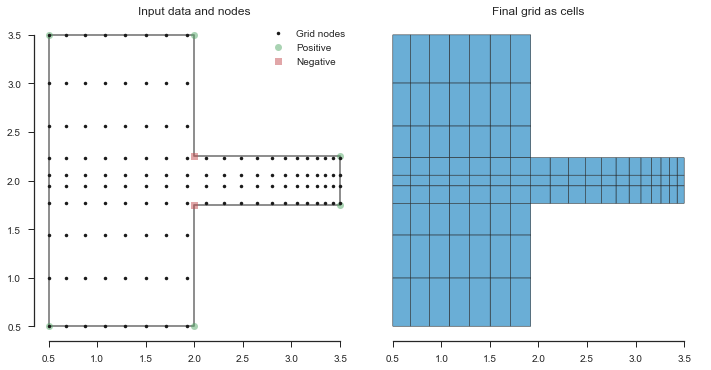
To continue with our running example, let’s focus in the points in the
size channel (pos=0.5, axis='y') so that we get 4 rows of nodes in
there.
Unrelated to focus, let’s bump up the column count to 20 so that when we
use use factor < 1 in the main body, it’s more obvious.
In [9]:
focus = pygridgen.Focus()
focus.add_focus(0.50, 'y', factor=5, extent=0.25)

grid = pygridgen.Gridgen(x, y, beta, shape=(10, 20), focus=focus)

fig, (data_ax, cell_ax) = pyplot.subplots(figsize=(10, 5), ncols=2, sharex=True)
plot_grid(grid,data_ax=data_ax, cell_ax=cell_ax, leg_loc='upper right')
fig.tight_layout()
The interactions between factor and extent can be tricky. The
example above applies a 5x focus to the middle 25% of the grid
(extent = 0.25). However, if we instead apply the focus to 50% of
the grid, we no longer achieve our goal of having 3 nodes in the side
channel.
¯\_(ツ)_/¯
In [10]:
focus = pygridgen.Focus()
focus.add_focus(0.50, 'y', factor=5, extent=0.50)

grid = pygridgen.Gridgen(x, y, beta, shape=(10, 20), focus=focus)

fig, (data_ax, cell_ax) = pyplot.subplots(figsize=(10, 5), ncols=2, sharex=True)
plot_grid(grid,data_ax=data_ax, cell_ax=cell_ax, leg_loc='upper right')
fig.tight_layout()
So now, let’s make the horizontal resolution of the main body more
sparse by using a factor < 1. This will have the side-effect of make
the horizontal channel more dense.
Thinking through this: - we want to make the columns more dense, so
dir='x' - in total, we have 20 x-nodes - the center of the main
body is at about the 5th node, so pos=5/20 - the main body is about
10 nodes wide, so extent=10/20.
Let’s try this out with a factor=0.5 and see how things are when
they’re half as dense:
In [11]:
focus = pygridgen.Focus()
focus.add_focus(0.50, 'y', factor=5.0, extent=0.25)
focus.add_focus(0.25, 'x', factor=0.25, extent=0.50)

grid = pygridgen.Gridgen(x, y, beta, shape=(10, 20), focus=focus)

fig, (data_ax, cell_ax) = pyplot.subplots(figsize=(10, 5), ncols=2, sharex=True)
plot_grid(grid,data_ax=data_ax, cell_ax=cell_ax, leg_loc='upper right')
fig.tight_layout()
Wait second, the side channel got less dense. What’s going?
Well, we avoiding this successfully so far, but it finally bit us. By
default, pygridgen assumes that the first coordinate pair of the
boundary is the “upper left”. But in this case, it’s acutally the lower
left. So a few things are backards. We can deal with it in two ways.
In the first, we simple move where we apply the focus to x=15/20
instead of 5/20.
In [12]:
focus = pygridgen.Focus()
focus.add_focus(0.50, 'y', factor=5.0, extent=0.25)
focus.add_focus(0.75, 'x', factor=0.25, extent=0.50)

grid = pygridgen.Gridgen(x, y, beta, shape=(10, 20), focus=focus)

fig, (data_ax, cell_ax) = pyplot.subplots(figsize=(10, 5), ncols=2, sharex=True)
plot_grid(grid,data_ax=data_ax, cell_ax=cell_ax, leg_loc='upper right')
fig.tight_layout()
Or, we could use the ul_idx parameter to tell pygridgen the
index of the coordinate of the upper left corner our boundary. For this
example, the upper left coordinates are the 8th items in their arrays,
so the index is 7.
In [13]:
focus = pygridgen.Focus()
focus.add_focus(0.50, 'y', factor=5.0, extent=0.25)
focus.add_focus(0.25, 'x', factor=0.25, extent=0.50)

grid = pygridgen.Gridgen(x, y, beta, shape=(10, 20), focus=focus, ul_idx=7)

fig, (data_ax, cell_ax) = pyplot.subplots(figsize=(10, 5), ncols=2, sharex=True)
plot_grid(grid,data_ax=data_ax, cell_ax=cell_ax, leg_loc='upper right')
fig.tight_layout()
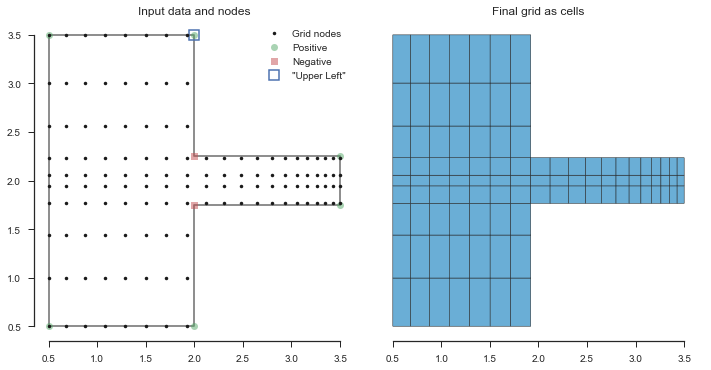
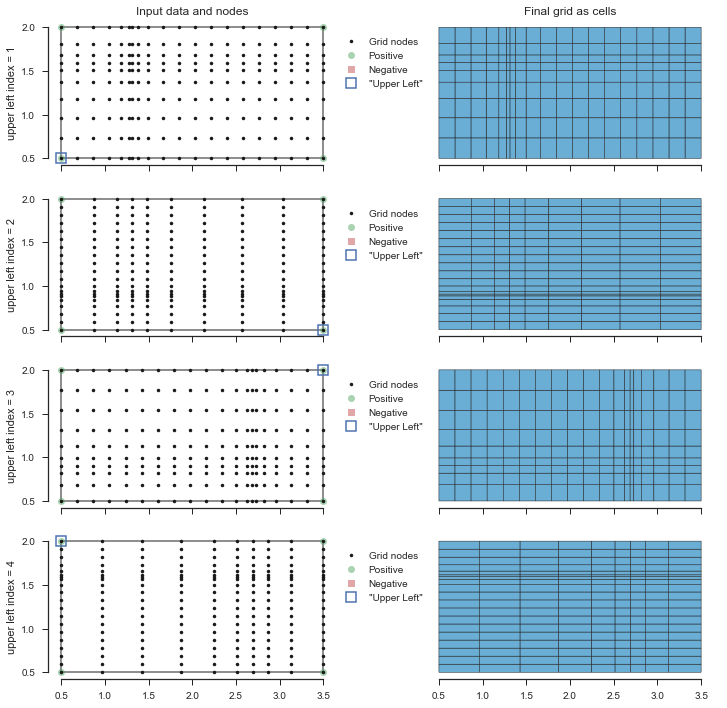
More on the upper left index parameter
This upper left index thing can really twist your mind around with more
complex shapes, so let’s use the simplest case to demostrate it’s
effects. Note that gridgen uses 1-based indexing for this paraneter,
so use ul_idx = 1 if your first point is the upper left corner.
We’ll use a simple rectangle with a 10 x 21 grid, with focus at
x = 7/21 and y = 7/10.
In [14]:
x = numpy.array([0.5, 3.5, 3.5, 0.5, 0.5])
y = numpy.array([0.5, 0.5, 2, 2, 0.5])
beta = numpy.array([1, 1, 1, 1, 0])

focus = pygridgen.Focus()
focus.add_focus(0.33, 'y', factor=3, extent=0.25)
focus.add_focus(0.70, 'x', factor=5, extent=0.10)

fig, axes = pyplot.subplots(nrows=4, ncols=2, figsize=(10, 10), sharex=True)
for n, axrow in enumerate(axes, 1):
    grid = pygridgen.Gridgen(x, y, beta, shape=(10, 20), focus=focus, ul_idx=n)
    plot_grid(grid, data_ax=axrow[0], cell_ax=axrow[1], leg_loc=(1.0, 0.5))
    axrow[0].set_ylabel('upper left index = {}'.format(n))

fig.tight_layout()